Related Articles You Might Find Interesting
-
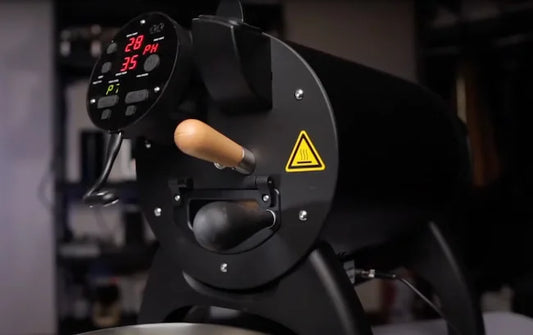
How to master roasting on an Aillio Bullet
Choosing a home coffee roaster can seem daunting, but there’s one which – according to Harmony Coffee founder Ben...
How to master roasting on an Aillio Bullet
Choosing a home coffee roaster can seem daunting, but there’s one which – according to Harmony Coffee founder Ben Rowe – stands above the rest as an all-rounder which...
-
Mastering Coffee Roasting: Expert Tips from Heartland Coffee’s Nath Prosser
Nath Prosser, Managing Director of Heartland Coffee Roasters, shares his expert insights on achieving the perfect roast every time. From...
Mastering Coffee Roasting: Expert Tips from Heartland Coffee’s Nath Prosser
Nath Prosser, Managing Director of Heartland Coffee Roasters, shares his expert insights on achieving the perfect roast every time. From trusting your taste over trends to understanding roasting curves, sourcing...
-
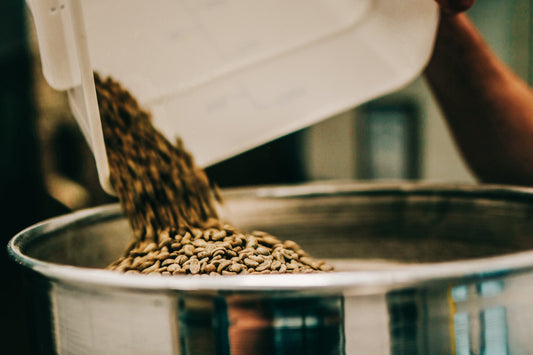
 Home Roasting
Roasting Coffee Beans at Home: Everything You Need to Get Started and Keep Improving
A complete guide to roasting coffee beans at home - covering every no-machine method from oven to air fryer, with...
Roasting Coffee Beans at Home: Everything You Need to Get Started and Keep Improving
A complete guide to roasting coffee beans at home - covering every no-machine method from oven to air fryer, with step-by-step instructions, roast level guidance, and everything you need to...